


Enhancing Financial Resilience Through Mortgage Stress Tests
The Data
This analysis draws on three primary data sources:
- Loan-Level Mortgage Origination Data
- Represents ~80% of new mortgages from OSFI-regulated entities (Crawford, Meh, and Zhou, 2013).
- Includes details on mortgage (origination date, balance, interest rate, LTV, GDS/TDS ratios, type, and amortization) and borrower (income and location by FSA).
- Focuses on high-ratio (insured) and low-ratio (uninsured) mortgages for new purchases.
- Credit History Data (TransUnion)
- Covers nearly all Canadian borrowers with monthly updates.
- Tracks liabilities (e.g., mortgages, loans) and borrower traits (credit scores, age, and location).
- Teranet–National Bank House Price Indexes
- FSA-level price indexes based on repeat-sales methodology, unaffected by property changes.
- Used by regulators to monitor housing market trends.
Regional Data Aggregation: Borrower data is consolidated by census agglomerations in urban areas and by FSAs in rural regions.
Mortgage Stress Test Policies: 2016 and 2018
These policies tightened qualification criteria, affecting high-ratio (2016) and low-ratio (2018) mortgages:
- Counterfactual TDS Ratio Analysis:
- New minimum qualifying rates (MQR) were applied to compute counterfactual TDS ratios for mortgages issued 12 months before and after the policies.
- 2016 Policy Impact:
- Pre-policy, 26% of high-ratio mortgages exceeded the 44% TDS threshold.
- Post-policy, virtually none did, demonstrating significant constraint on high-ratio mortgage approvals.
Chart 2 visualizes the reduction in mortgages exceeding TDS limits, illustrating the policy's effectiveness.
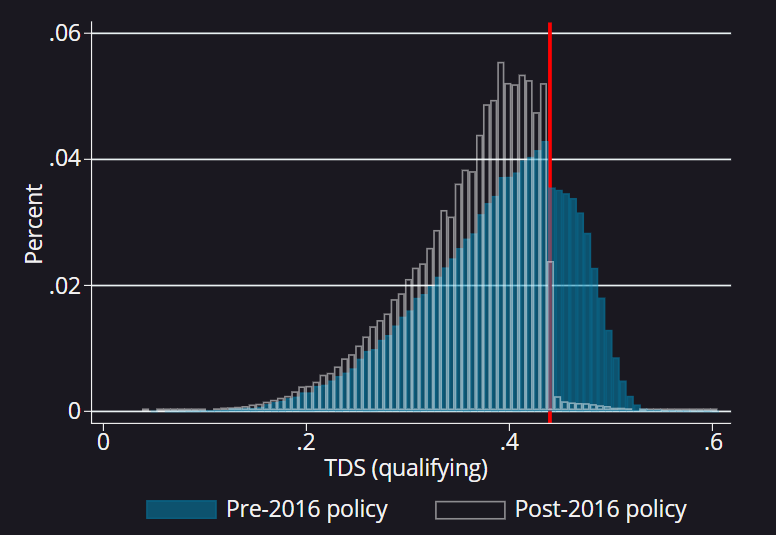
Impact of 2016 and 2018 Mortgage Stress Test Policies on TDS Ratios 2016 Policy (High-Ratio Mortgages)
Chart 2 compares the total debt service (TDS) ratios for high-ratio mortgages before and after the October 2016 policy.
- Pre-Policy:
- Blue bars represent mortgages issued between October 2015 and September 2016.
- Under the new rules, 26% of these mortgages would have exceeded the TDS threshold of 44%.
- Post-Policy:
- Black-outlined hollow bars represent mortgages issued between November 2016 and October 2017.
- Virtually no mortgages exceeded the 44% TDS limit, demonstrating the policy's effectiveness in constraining high-ratio mortgage issuance.
2018 Policy (Low- and High-Ratio Mortgages)
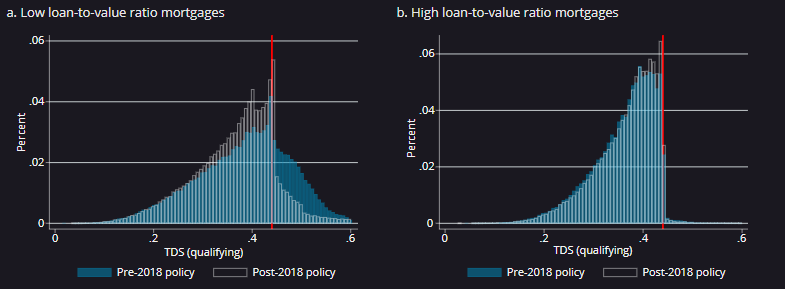
Chart 3 extends this analysis to the January 2018 policy, which primarily affected low-ratio mortgages.
- High-Ratio Mortgages (Panel b):
- Minimal differences between reported TDS ratios and counterfactual calculations indicate that the 2016 policy had already enforced TDS constraints effectively.
- Low-Ratio Mortgages (Panel a):
- Pre-Policy:
- Blue bars show that 29% of low-ratio mortgages issued between January 2017 and December 2017 would have exceeded the 44% TDS limit under the 2018 rules.
- Post-Policy:
- Black hollow bars indicate that 13% of low-ratio mortgages issued after January 2018 had qualifying TDS ratios above 44%.
This post-policy percentage reflects a balance between regulatory influence and FRFIs’ risk tolerance, with the 44% TDS limit remaining a significant, though non-binding, constraint for low-ratio mortgage qualification.
Sources:
- Office of the Superintendent of Financial Institutions
- Bank of Canada Calculations (Last observation: October 2017)
Regional Impacts of 2016 and 2018 Mortgage Stress Test Policies
The disqualified share refers to the proportion of mortgages issued in the 12 months preceding a policy that would not have qualified under the new rules. This measure, shown as the blue area to the left of the 44% TDS threshold in Charts 2 and 3, highlights the policies' restrictive effects across regions.
Key Observations:
- 2016 Policy (High-Ratio Mortgages):
- Targeted high-ratio mortgages, leading to disqualifications primarily in areas with more first-time homebuyers and higher loan-to-value (LTV) ratios.
- 2018 Policy (Low-Ratio Mortgages):
- Broader reach, affecting low-ratio mortgages, with a stronger impact in markets like Toronto and Vancouver, where property values and mortgage sizes are higher.
Geographical Variation:
Figure 1 illustrates regional differences in the disqualified share for both policies:
- The 2018 policy had a more pronounced effect in Greater Toronto and Vancouver compared to the 2016 policy. This aligns with these areas' higher prevalence of low-ratio mortgages and greater sensitivity to stricter TDS requirements.
- Regions with fewer high-value properties or lower homebuyer activity showed less impact from either policy.
By analyzing disqualified shares by geography, we see how each policy uniquely influenced borrowing behavior, reflecting regional housing market characteristics and mortgage profiles.
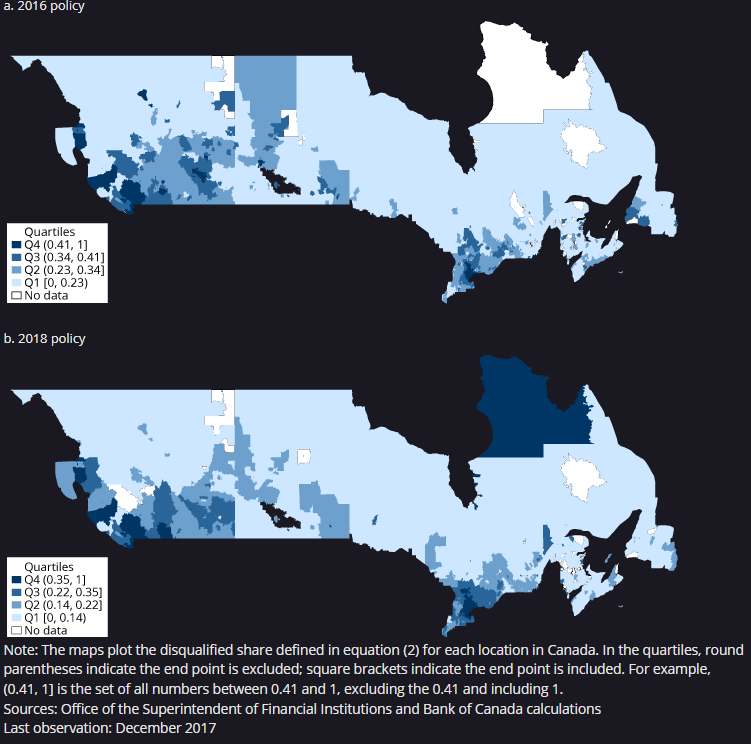
Regional Disparities in Policy Impact
The disqualified share, as mapped across Canada, highlights how the 2016 and 2018 mortgage stress test policies affected different locations. These maps categorize locations into quartiles based on disqualified shares, with brackets indicating whether endpoints are included or excluded (e.g., (0.41, 1] includes 1 but not 0.41).
Key Findings from Table 1
- Characteristics of Highly Exposed Areas:
- Locations with disqualified shares above the median show:
- Higher Loan-to-Value (LTV) Ratios: Suggesting more leveraged borrowers.
- Lower Incomes and Credit Scores: Indicating increased financial vulnerability.
- For the 2018 policy, these areas also experienced higher house price growth, emphasizing their sensitivity to tighter mortgage rules.
- Consistent Metrics Across Areas:
- Minimal differences were observed in:
- Total Debt Service (TDS) and Gross Debt Service (GDS) ratios.
- Payment-to-income ratios.
- Average amortization periods and mortgage rates.
Implications
The higher exposure of certain regions, particularly those with rapidly rising house prices, underscores the stress test policies’ focus on mitigating risk in overheated markets. By limiting high-LTV borrowing and imposing stricter qualification standards, these measures aimed to enhance financial stability, particularly in areas most vulnerable to economic or housing market shocks.
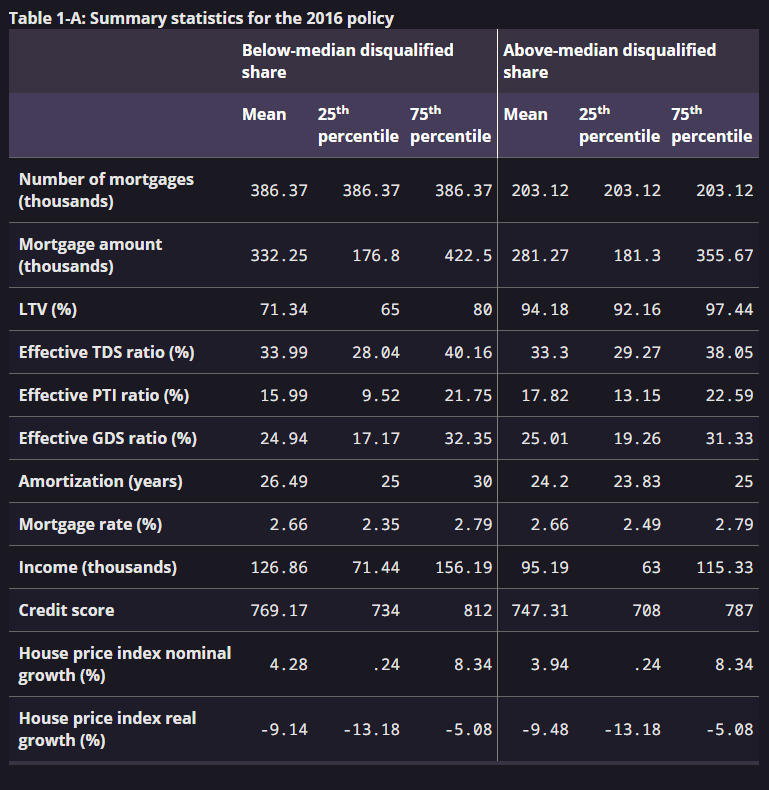
Key Metrics and Observations (October 2015 – September 2016)
This dataset provides insights into borrower and mortgage characteristics during the year leading up to the 2016 policy implementation, highlighting the financial profiles and lending practices of the period.
Key Metrics
- Loan-to-Value (LTV) Ratio:
Indicates the proportion of a mortgage loan relative to the appraised property value. High LTV ratios signify greater borrower leverage and risk. - Total Debt Service (TDS) and Gross Debt Service (GDS) Ratios:
Measure the share of household income allocated to debt payments. TDS includes all debts, while GDS focuses on housing costs. - Payment-to-Income (PTI) Ratio:
Represents the burden of mortgage payments relative to income.
Observations:
- Borrowers in high-LTV categories faced greater exposure to financial vulnerability under the 2016 policy due to stricter qualification criteria.
- The stress test policy introduced significant constraints, aiming to reduce systemic risk by limiting high-LTV borrowing.
- TDS, GDS, and PTI ratios were pivotal in assessing borrower financial resilience during the policy transition.
These metrics collectively shaped the evaluation and implementation of stress test rules, forming the foundation for a more robust and resilient mortgage market.
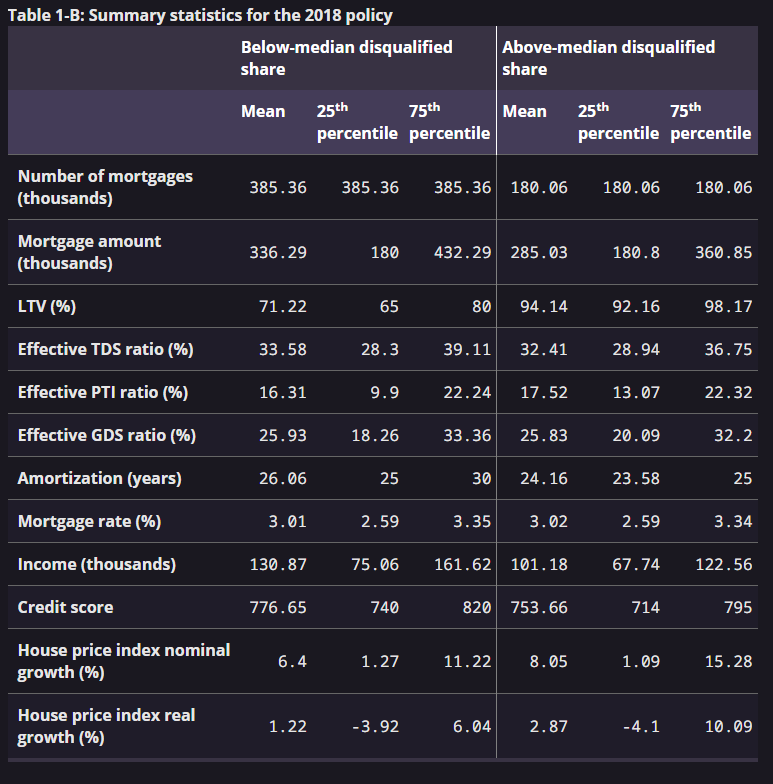
Note: LTV is the loan-to-value ratio, TDS is the total debt service ratio, GDS is the gross debt service ratio, and PTI is the payment-to-income ratio. The data covers January to December 2017 from sources including the Office of the Superintendent of Financial Institutions and Teranet-National Bank, with calculations by the Bank of Canada.
To evaluate the effects of macroprudential policy changes, a difference-in-differences approach is used. This method examines variations in the disqualified share across locations. The analysis estimates the impact of these policies on mortgage market variables such as the effective TDS ratio, mortgage size, credit score, LTV ratio, purchase values, and local house price growth.
The main coefficient in the empirical model determines if the policy induced behavioral changes in areas with greater exposure to the policy. Results are split between the 2016 and 2018 policy implementations, analyzing all mortgages and subsets of low- and high-ratio mortgages. Qualitative findings are summarized in Table 2, with detailed quantitative results provided in Appendix A.
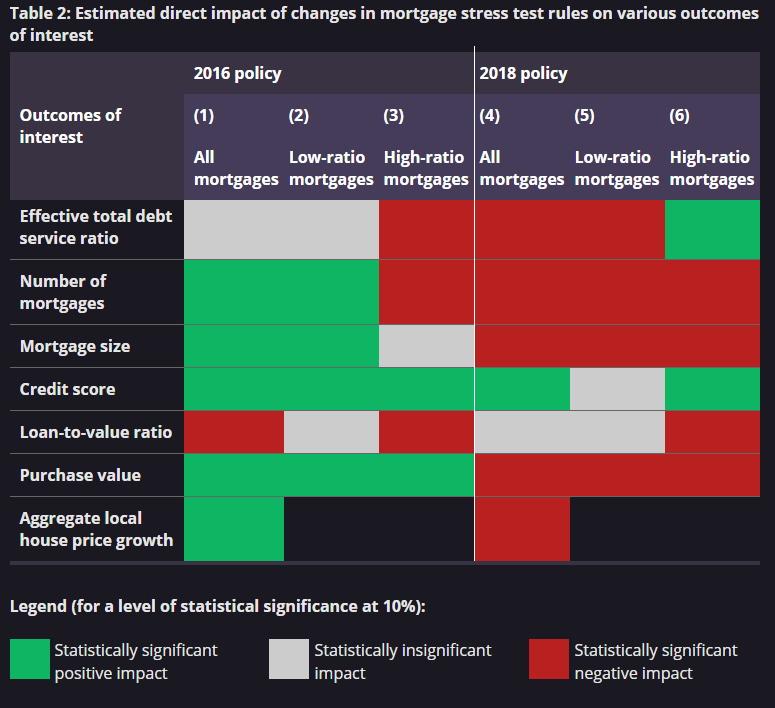
Key Findings on Mortgage Policies and Their Impact
The study analyzes the effects of Canada’s 2016 and 2018 macroprudential policies and the 2022–23 monetary tightening, focusing on mortgage markets, credit quality, and borrower resilience.
2016 Policy (Targeting High-Ratio Mortgages)
- Effective TDS Ratio: High-ratio mortgages showed reduced TDS ratios in heavily impacted areas, confirming compliance with policy. No significant changes were seen for low-ratio mortgages.
- Mortgage Trends: High-ratio mortgage issuance fell, while low-ratio mortgages saw increased issuance and larger average sizes, indicating a shift toward low-ratio loans.
- Credit Quality: Borrowers improved their credit scores and down payments, particularly in areas most exposed to the policy.
- House Prices: Neither average purchase value nor house price growth slowed significantly.
2018 Policy (Targeting Low-Ratio Mortgages)
- Market Effects: Reduced mortgage issuance, average loan sizes, and slower house price growth in heavily exposed areas.
- Credit Quality: Improvements in credit scores and down payments for high-ratio mortgages suggest an indirect policy impact, possibly reflecting a shift to alternative lenders.
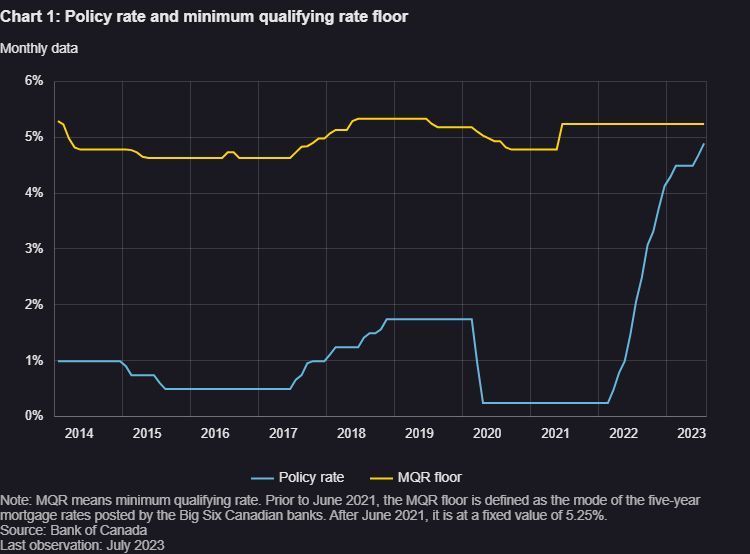
2022–23 Monetary Tightening
During this period of rising interest rates, the study assessed whether stress tests helped borrowers avoid delinquencies. Between March 2022 and October 2023, the Bank of Canada raised rates from 0.25% to 5.0%. Borrowers in areas more affected by macroprudential policies showed varying delinquency rates, demonstrating that stress tests may mitigate financial vulnerability in adverse conditions.
These findings highlight the critical role of targeted mortgage policies and stress tests in balancing market growth, credit quality, and financial resilience during economic shifts.
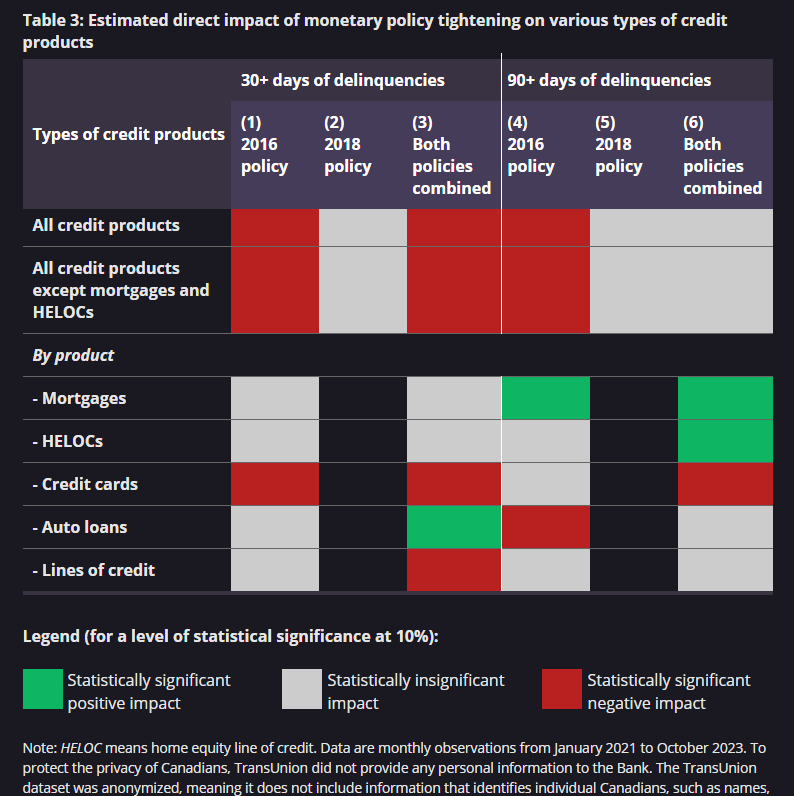
Insights on the Impact of Mortgage Stress Tests in Canada
Recent analysis highlights the effectiveness of mortgage stress tests in enhancing financial stability, particularly during periods of monetary policy tightening. Using anonymized data from January 2021 to October 2023, the study examines the outcomes of Canada’s 2016 and 2018 macroprudential policies on credit delinquencies and overall borrower resilience.
Key Findings
- Impact of the 2016 Policy
- Targeting high-ratio mortgages, the 2016 policy improved credit quality by reducing debt service ratios and increasing borrower resilience.
- During the 2022–23 monetary tightening, delinquencies in areas most exposed to the 2016 policy rose less significantly than in less exposed areas, particularly for non-mortgage credit products like credit cards and auto loans.
- The policy indirectly bolstered resilience against rising mortgage payments, even though some borrowers shifted to unregulated lenders.
- Impact of the 2018 Policy
- By expanding stress tests to low-ratio mortgages, the 2018 policy effectively curbed credit and house price growth.
- The stress tests improved borrower quality within the regulated market but had less impact on 90-plus day delinquency rates for non-mortgage credit products compared to the 2016 policy.
- General Trends
- Borrowers subject to stress tests demonstrated better financial preparedness during the 2022–23 interest rate hikes, reducing the likelihood of delinquencies.
- Areas heavily exposed to macroprudential policies showed a subdued increase in delinquency rates, underscoring the policies’ effectiveness.
Conclusion
Mortgage stress tests have proven to be a vital tool in ensuring financial stability. While the 2016 policy improved borrower credit quality, the 2018 policy successfully mitigated housing and credit market booms. Together, these measures enhanced borrower resilience, helping households manage significant increases in mortgage payments without falling behind on obligations during economic uncertainty.
These findings reaffirm the importance of well-designed macroprudential policies in safeguarding the financial system and promoting economic resilience.


DÉTAILS DU CONTACT
Orbis Groupe Hypothècaire
Adresse: 285 Pl. d'Youville Suite #9, Montreal, Quebec H2Y 2R6
Courriel: carlos.beauregard@groupeorbis.com
LA NAVIGATION
Heures de travail
- Lun - Ven
- -
- Sam - Dim
- Fermé